The histogram to a beginner can look like an intimidating feature that makes no sense at all but it is an extremely powerful tool once you grasp the fundamentals of what it is and how to read it. Once you know how to use the histogram of your digital camera it will revolutionise the way you take photos and will give you confidence that the images you have captured are perfectly exposed.
One main thing you need to understand about your histogram is it is the truth about the image you just have captured, the image you see on your camera’s LCD screen is just an interpretation of the image. The photo you see on the back of your LCD is subject to screen quality, LCD brightness and also the environment around you causing glare on your screen. What doesn’t change with all these factors is your histogram.
Once you understand your histogram it will give you a lot of security to know that you have captured your photo well and have maxamised your image capture and that you have detail in your shadows and highlights as the histogram will show you.
In this article I am going to talk about what it’s histogram, how it is made up, how to read it and how to apply it out in the field.
WHAT IS YOUR HISTOGRAM
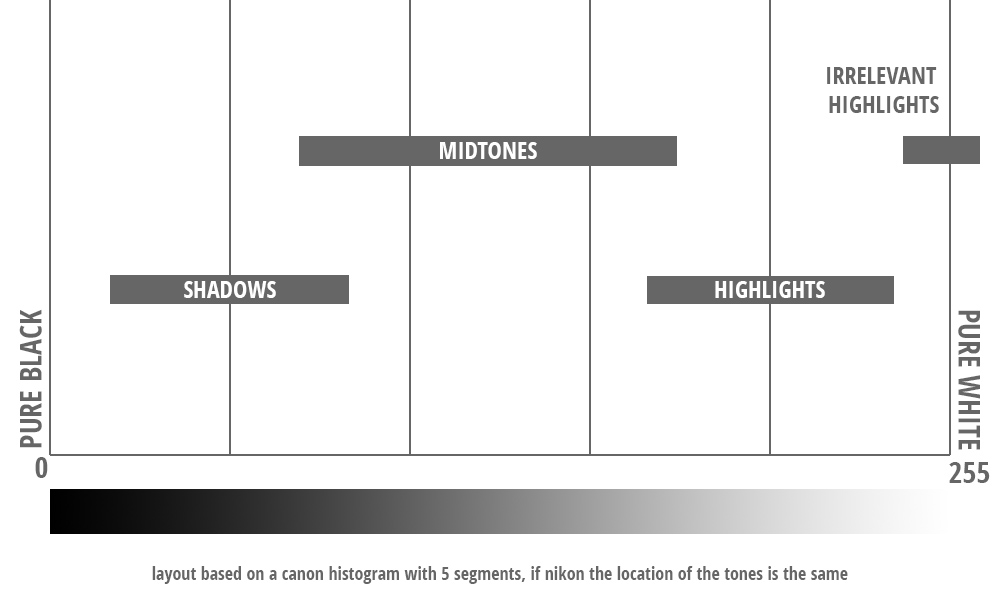
Your histogram is a graph that represents the tonal range (brightness / luminosity) of your image between 0 which is pure black (on the far left) and 255 which is pure white (on far right). The height of the spikes in your histogram represent the amount of tones in your image that have the same value. So an image with a lot of darker shadow areas you can expect to see the histogram favor the left-hand side, for an image with a lot of highlights and minimal shadow areas you can expect it to favor the right hand side of the histogram.
The histogram you’re interested in is the one that is black and white. If you’re looking at the screen with four histograms one black and white, one red, blue and green these are the histograms that represent the RGB colour channels.
In the above graphic you can see five segments this is only because the example above is what a histogram looks like on a Canon camera, for a Nikon user it is divided up in four segments. What’s important is where things are placed on the histogram and this will be the same.
There isn’t going to be an absolute hard and fast rule on what a histogram is going to look like. But once you understand what you’re looking at and what the spikes on your histogram represent in your image, then you’re going to be able to make your own decisions on whether your image needs more or less exposure for it to be truly a correct exposure. My article on “Exposing to the Right – Histogram Shooting” is a good read that points out the hidden trap photographers get into with not understanding that different scenes have a different histogram and sometimes the right place is for it to stay to the left or right on the histogram as the image doesn’t have any shadows or highlights.
Why does the irrelevant highlights extend past the 255 point on the histogram? The reason for this is when you’re looking at your histogram on your camera’s LCD screen it’s a Jpeg preview of the file that is captured. So if you’re shooting in RAW when you go to open that image in Photoshop you will find that if your image has only just indicated that it has clipped on your camera’s histogram then you will find that the RAW file isn’t clipped at all. So sometimes knowing this you can push your exposure that extra 1/3rd of a stop to get more exposure brightness into your image even if you see your image start to clip in areas.
WHAT IS AN IRRELEVANT HIGHLIGHT
An irrelevant highlight is something which is brighter than your main histogram highlight (so it will sit to the right of this) and only represents a very small amount of the overall image. On your histogram it will be represented as a very low in height trail that will lead off from the main highlight section. More often than not your irrelevant highlight can be clipped in your histogram, meaning one or all three colour channels have passed 255. If there was a lot of irrelevant highlights in your image, then this is actually your main highlight and should be treated as such. The irrelevant highlight is out of the scope that can be controlled with a filter or to compensate for it will make the bulk of the image suffer (ie darker than what it should be). An irrelevant highlight will be something like a street light, the rising or setting sun reflecting in building windows, the sun itself, reflection off a surface, the white in a crashing wave etc.
If you have parts of your image that have these and you want to include some captured detail in them then you can take an underexposed image and blend in the detail later in photoshop. Or you can use the clone stamp tool in photoshop and clone in a similar part of the image into this area at a reduced opacity just so there is some texture in there.
THE DECAPITATED HISTOGRAM SPIKE
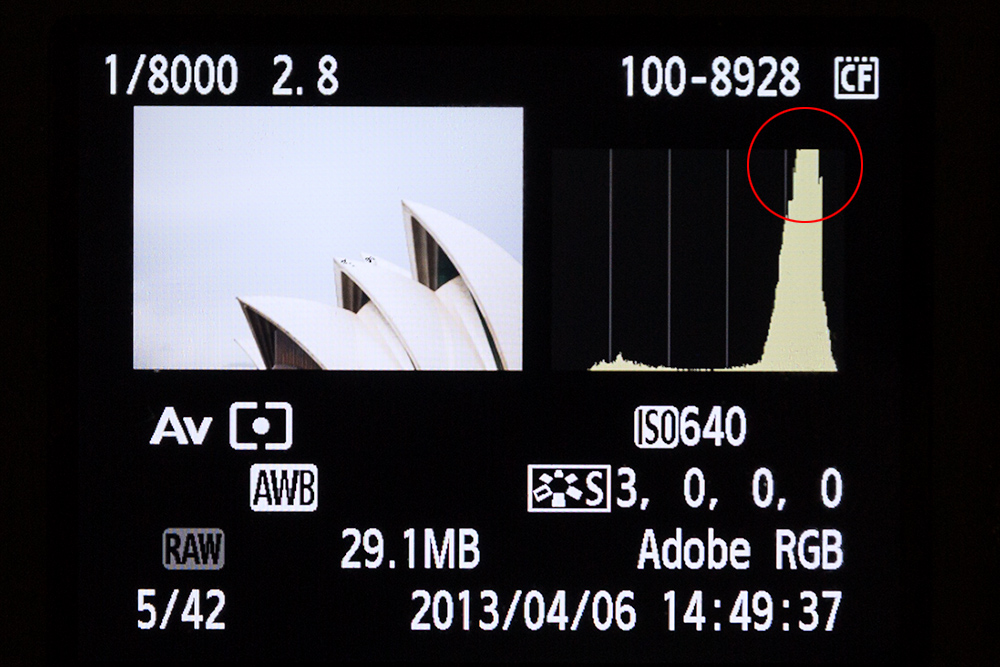
Sometimes when you’re out shooting you will notice that the histogram of your image has a spike that is cut off at the top. This is totally normal, all it means is that you have a large amount of that tonal range in your image and it is point less to show it fully on the histogram. If they made the histogram double the height then you would see it, but all you need to know is that there is a lot of that tone, what is important is what sits between the histogram.
PARK YOUR HIGHLIGHTS IN THE CORRECT SPOT
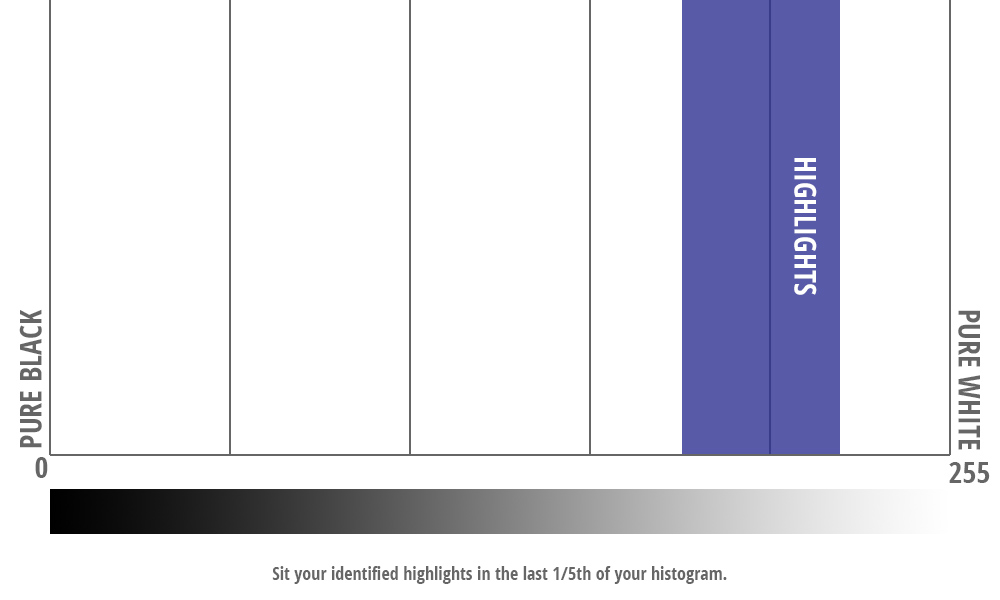
Your histogram is all about making sure you identify and correct issues with your exposure and then place the histogram in the right place within the 0 and 255 range that you have. Now that we know what an irrelevant highlight is let’s focus on the main highlights of the image. When you have an image that is controlled and the histogram is correct the next part is placing it correctly on the histogram. When your highlights are correct the rest of your image will benefit.
More often than not if your shooting in AV mode your camera will do a great job in finding your starting point, but if you took those capture settings of Aperture and Shutter speed and dialed them into the Manual setting on your camera you can improve on the image even further, as you will find the shot on AV mode can be conservative and you will be able to tell this from seeing where the main highlights are sitting on the histogram.
From my experience in shooting, editing and selling daytime images the spot that I look for when placing my highlights on my histogram is 1/5th from the end of the histogram right hand side. ie on a canon camera the last visible line that breaks up the histogram in 1/5th sections.
KNOWING WHATS WHAT ON YOUR HISTOGRAM
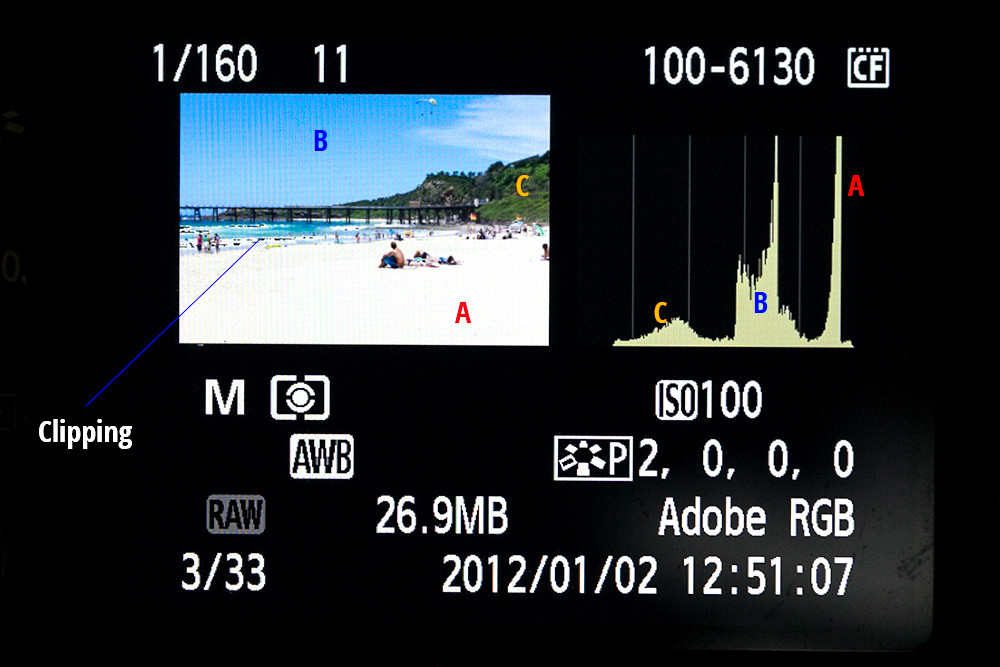
In the above example, you can see three clear areas that are represented on the histogram. The white sand of the beach is obviously going to be the brightest point in the image and as such it will live on the right hand side of everything. The next bright area is going to be the sky and this is sitting behind the sand, next we have the green vegetation and you can clearly see that is the darker area of everything. So this sits behind everything. Because there is a lot of sand with a similar tone the spike is higher. Same as the blue sky. The tonal range of the green vegetation is lower as there is less of it in the image.
My identified highlight of the sand is sitting clearly right in the histogram. If my exposure was 1/250th of a second (3/2rds of a stop less) the image would still look good, but the highlights wouldn’t be placed “in the right spot” the additional 2/3rds of a stop exposure lifts the whole image, especially the green vegetation area and I would call this image “histogram perfected”.
The clipping in the area is what will happen when pushing your exposure. At 1/250th of a second it might not have happened, even at 1/200th, but at 1/160th of a second it happens and I know what with shooting RAW the file isn’t really clipped, it is just clipped as a Jpeg preview. This is why understanding what your histogram is telling you and how it works is important.

THE DISTRIBUTION OF INFORMATION
The above example is from a shoot I did where I shot a series of images to Exposure Blend. Each image is a two stop jump what is interesting is when you look at the image that is 1/60th of a second the RAW file size is 22.3MB and the histogram is sitting very left. With the next image of 1/15th of a second the RAW file is 23.3MB and the histogram still favors the left. Now with the last image of 1/4 of a sec the RAW file size is 24.9MB. The just is much larger than the other two in information and when you look at the histogram of the image there is a lot more of the image now sitting on the right hand side of the histogram.
Over the histogram area between 0 and 255 (ie Shadow and Highlight) is the distribution of information. The more your image sits on the right hand side the more information it has meaning you can work the image more to get better detail without causing post production artifacts in the shot. This is a key reason why you will hear terms like Exposing to the Right. A shooting technique where you push your images right or as far right as you can to maximise this captured information. But as my article talks about be careful as not all image should sit right.
Now when you open your RAW file no matter what the RAW file says in terms of size it will open to the native size TIFF file that your camera produces and in this case my 5D MK 3 opens the file at 63.3MB @ 8 bit.
This is why it is important to make sure your single images are exposed correctly and why balancing them with Neutral Density Graduated Filters as you get to control your highlights that allow you to add more exposure to your image, which will bring your shadows further to the right, equalling more information / detail in those shadows.
FIELD TEST
One of the best ways to understand is to test things out for yourself. Next time you’re out shooting take a series of images deliberately in a sequence from really under exposed to extremely over exposed and do it in one stop increments (If you’re unsure of what a stop is then I have this article “What is a Stop“).
Now take those images and review them on your screen and computer.
If you’re out shooting and you think you have a great exposure just take an extra image a stop over and under and check them out. I use to do this all the time when I was shooting with my ND grad filters the extra stop over exposed gave me that little extra detail in shadow areas to blend in and the under exposed gave me more detail in some of that high key highlights and sky blue. It also showed me the importance a histogram plays in making sure your exposure is right.
DEVELOP A GOOD RELATIONSHIP
The LCD screen on your camera depending on your make and model can be really good or really bad. In my article “Setting up your Digital Camera Correctly the First Time” I talk about making sure your screen brightness is correct as it won’t affect your histogram but it will the visual image.
Now the reason why I am talking about the LCD screen is that once you look at your histogram all the time for shooting you’re obviously going to be also looking at your LCD screen and the image that was shot. Over time you are going to develop an understanding of what you see on your screen as the visual image and know if it is a good shot or not without looking at your histogram for confirmation that it is. This is the stage where I am with my shooting. My reliance on the histogram has reduced as I know what my image should look like on the rear screen.
However I still will check it at least a few times with every shoot just to make sure everything is looking good, if I can push an exposure just a little bit more, where and my irrelevant highlights are clipping, it is isn’t obvious.
As a beginner, I would highly recommend that you make your histogram your new best friend when out shooting. Get to know it well and what it is telling you about your image.











Thanks for this article. It has helped answer/confirm a few of my questions about histograms. I’ve been using histograms often lately because I’ve not been happy with exposure results. Burnt out highlights are poor and my processing skills of images is basic. It helps to get the exposure ideal, right at the beginning.